Eight checks.
One verdict.
Everything the harness does, in order, with the boundary of each check stated next to it. Nothing here is described as more than it is.
Run it in ten seconds
No setup, no database, no API keys. The certifier is a script in the repository, and the demo file is a CSV with 600 real prediction rows.
npx tsx scripts/certify-model.ts examples/vendor-model-sample.csv --configurations 20The file claims an accuracy of 78.00%.
That claim is NOT used for scoring below.
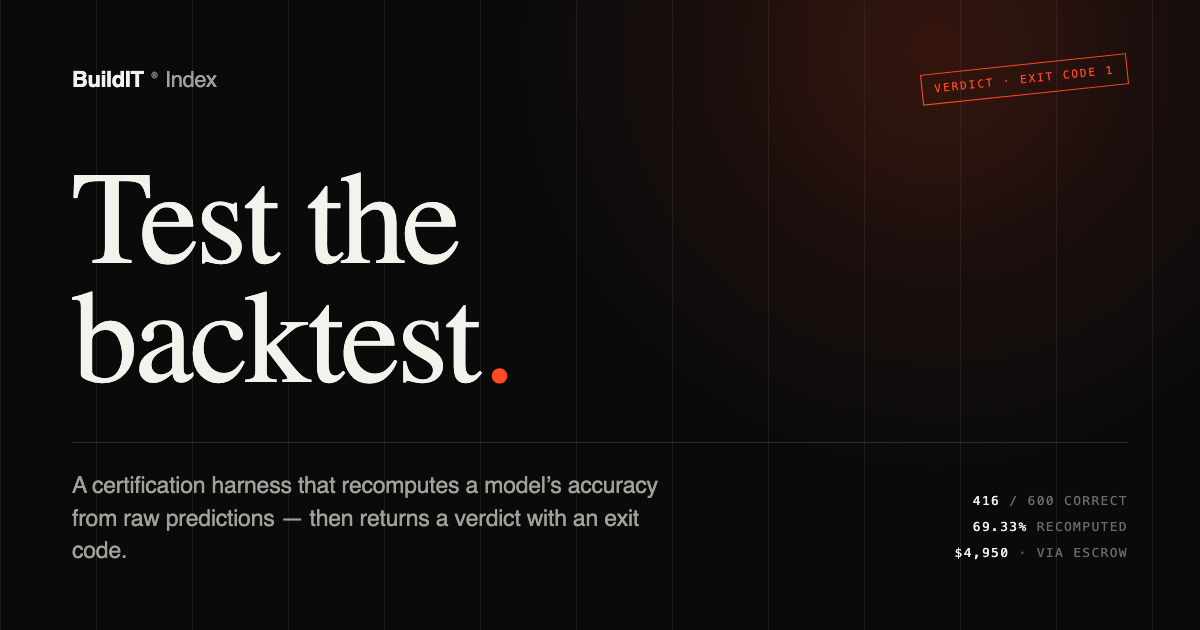
directional accuracy : 69.33% (416/600)
baselines beaten : 5/5 <- looks great!
earliest → latest : 80.00% → 55.83%
[FAIL] consistent out of sample
VERDICT: OVERFIT
The model looked promising in-sample and did not hold up out of sample:
accuracy fell from 80.0% on the earliest fold to 55.8% on the latest.
Tuning against this data will make it worse, not better.It beat every baseline and still failed. That is the whole point: a screen that stops at the headline accuracy would have passed it.
You are buying the tool that proves the number, not a predictive edge.
The eight checks
Each check below is either a verdict gate or a stated library function. The difference matters, and it is written on every line.
08/08
Select a check to read exactly what it does — and where its boundary is. Nothing here is described as more than it is.
Accuracy is recomputed from raw predictions. Any claimed-accuracy column in the file is ignored entirely.
The model is compared against baselines computed from the data supplied — not against a number someone wrote down.
Accuracy is measured fold by fold, earliest to latest, so decay shows up instead of hiding inside one average.
Trying many configurations and reporting the best one is corrected for — the more you tried, the harder it is to pass.
Every accuracy figure carries a Wilson interval, so a small sample can’t dress up as certainty.
Checks for leakage — information in the test data that the model shouldn’t have had when it made the prediction.
When a candidates file is supplied, the harness estimates the probability that the chosen model only looks best because many were tried.
Checks whether the model’s stated confidence matches how often it is actually right.
What decay
looks like
In the verified demo, the sample model starts at 80.00% and ends at 55.83%. The overall 69.33% hides the story. The folds tell it.
One average can flatter a model; a sequence cannot.
Fall across folds −24.17 pts
Only the earliest fold, latest fold, and overall figure are shown — exactly the numbers the demo returns. No intermediate folds are invented.
- Input
- Predictions as a CSV. Any claimed-accuracy column is ignored.
- Output
- Recomputed accuracy, Wilson interval, verdict and an exit code — exit 1 means fail.
- Targets
- The /certify page certifies DIRECTION only. All four targets — DIRECTION, PRICE, RANKING, CALIBRATION — run from the CLI.
- Database
- None required for the certifier.
- Walk-forward
- Period stability across folds. Purged walk-forward is a tested library function, not a verdict gate.
- PBO
- Needs a candidates file. Null for single models, and never a gate.
- Platform
- 73 pages · 102 routes · 50 Prisma models · ~172,000 lines in src · 452 commits.
- Runtime
Node 22required — Node 24 breaks the Prisma install.
What it does not do.
It does not pick models.
It judges a claim you already made. Nothing in the harness chooses a strategy, a universe, or a horizon.
It does not execute trades.
The platform is paper trading only. There is no live broker execution, and no licensed market-data feed is included.
It does not guarantee the future.
A pass is a statement about the data supplied — not a promise that the model will work on new data, or that it will make money.
It does not clean your data.
Predictions go in as a CSV. If the rows are wrong, the verdict describes the rows, not reality.